
|
Library of Functions Target A
|

|
How far away from \( 0 \) is \( 5 \)? How far away from \( 0 \) is \( -5 \)?
If \( |x| = 3 \), what value does \( x \) hold? |
What is an absolute value function? What does the graph of an absolute value function look like? Take a look at the following function, table, and graph.
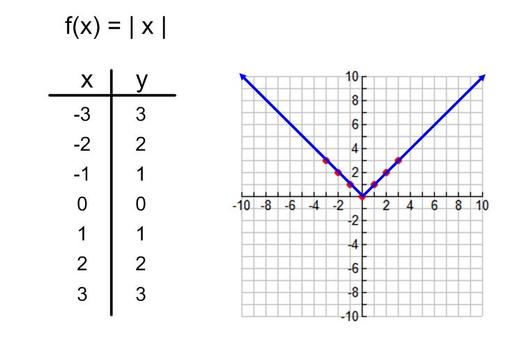
As you can see, the graph of the absolute value function is in the shape of a V. The vertex of the graph is the point at which the graph changes direction. In this example, the vertex is located at \( (0, 0) \) because that is the point at which the graph changes direction.
The standard equation for absolute value functions is: \( f(x) = a |x-h|+k \)
The \( a \) value is essentially the slope of the function, although as we will see later, we cannot define the slope to be exactly the same as the a value, because the slope changes depending on which portion of the graph you are looking at (the different portions are called intervals). The \( h \) and \( k \) form an ordered pair \( (h, k) \) which represents the vertex of the graph of an absolute value function. When graphing an absolute value function, these are the three pieces of information that need to be identified in order to graph your function correctly.
Graphing an Absolute Value Function
When graphing an absolute value function, identify the \( a, h, k, \) from the equation. Start by plotting the vertex first, then use the \( a \) value to graph the rays that form the absolute value graph. Take a look at the video to see an example.
Graphing an Absolute Value Function
When graphing an absolute value function, identify the \( a, h, k, \) from the equation. Start by plotting the vertex first, then use the \( a \) value to graph the rays that form the absolute value graph. Take a look at the video to see an example.
Identifying Domain and Range of an Absolute Value Function
The domain of an absolute value function is always the set of all real numbers. The reason being is that the graphs of the absolute value functions will continue on forever in the left and right directions, eventually spanning all possible x-values. The range of an absolute value function is a little different. The range is determined by the location of the vertex of the graph (specifically the y-value of the vertex). The range of the function will be written as an inequality. If the graph opens up, then the range is the set of all possible numbers that are greater than or equal to the y-value of the vertex. If the graph opens down, then the range is the set of all possible numbers that are less than or equal to the y-value of the vertex. Take a look at the graphs below.
The domain of an absolute value function is always the set of all real numbers. The reason being is that the graphs of the absolute value functions will continue on forever in the left and right directions, eventually spanning all possible x-values. The range of an absolute value function is a little different. The range is determined by the location of the vertex of the graph (specifically the y-value of the vertex). The range of the function will be written as an inequality. If the graph opens up, then the range is the set of all possible numbers that are greater than or equal to the y-value of the vertex. If the graph opens down, then the range is the set of all possible numbers that are less than or equal to the y-value of the vertex. Take a look at the graphs below.
|
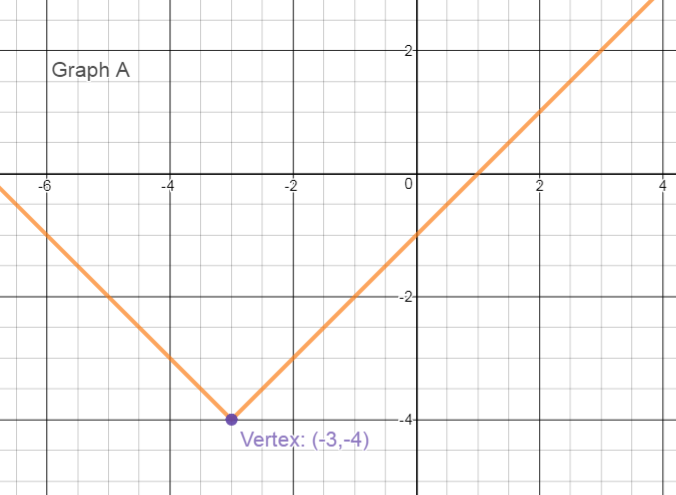
Graph A
Domain: \( \mathbb{R} \)....The domain of an absolute value function is always the set of all real numbers. Range: \( \{ y: y \geq -4 \} \)...The graph opens up and the \(y\)-value of the vertex is \( -4 \). |
|
|
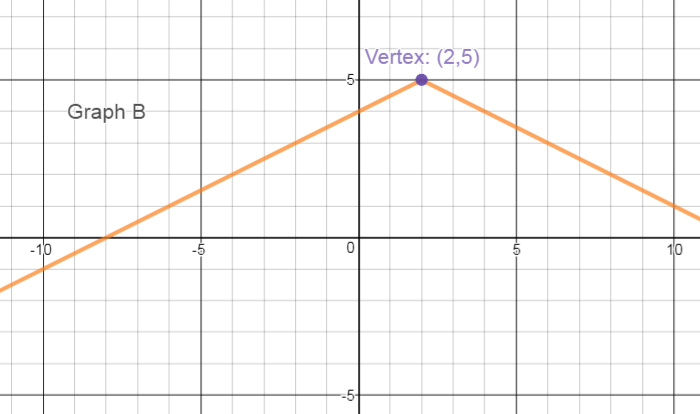
Graph B
Domain: \( \mathbb{R} \)....The domain of an absolute value function is always the set of all real numbers. Range: \( \{ y: y \leq 5 \} \)....The graph opens down and the \(y\)-value of the vertex is \( 5 \). |
|
Determining if an Absolute Value Function is Increasing or Decreasing
Since there is a point on an absolute value graph (vertex) where the graph changes direction, the graph of an absolute value function can either be increasing (going up from left to right) or decreasing (going down from left to right). It can change depending on the interval. An interval is basically of span of the graph which is determined by a set of \(x\)-values. Let's take a look at the graph of \( g(x) = -\frac{1}{2}|x + 1| + 7 \) below to determine if the function is increasing or decreasing.
To determine if the function is increasing or decreasing over the interval \( -8 \leq x \leq -4 \), we need to look at the portion of the graph that spans from where \( x \) has a value of \( -8 \) to where \( x \) has a value of \( -4 \). You can see in the diagram that red dashed lines show this piece of the graph. Next, look at what's happening with the graph as we go from \( -8 \) to \( -4 \). That portion of the graph is going UP as we move from LEFT to RIGHT. So we can say that the function \( g(x) = -\frac{1}{2}|x + 1| + 7 \) is increasing over the interval \( -8 \leq x \leq -4 \). The second interval given is \( 3 \leq x \leq 9 \). This means we want to look at the portion of the graph that spans from where \( x \) has a value of \( 3 \) to where \( x \) has a value of \( 9 \). This interval is shown by the green dashed lines. As we go from where \( x \) is \( 3 \) to where \( x \) is \( 9 \), you can see that the graph of the function is going DOWN as we move from LEFT to RIGHT. Because the graph is going down from \( 3 \) to \( 9 \), we can say that the function \( g(x) = -\frac{1}{2}|x + 1| + 7 \) is decreasing over the interval \( 3 \leq x \leq 9 \).
Writing Absolute Value Functions
Just like with graphing absolute value functions, when writing absolute value functions, there are three key pieces of information that is needed: \( a, h,\) and \( k \). Remember that the vertex of the graph of a function represents \( (h, k) \). So when writing a function, once the \( a, h,\) and \( k \) have been identified, it is just a matter of substituting those values into the standard equation for an absolute value function: \( f(x) = a|x - h| + k \). Watch the videos below to see some examples on how to write an absolute value function from a graph.
Just like with graphing absolute value functions, when writing absolute value functions, there are three key pieces of information that is needed: \( a, h,\) and \( k \). Remember that the vertex of the graph of a function represents \( (h, k) \). So when writing a function, once the \( a, h,\) and \( k \) have been identified, it is just a matter of substituting those values into the standard equation for an absolute value function: \( f(x) = a|x - h| + k \). Watch the videos below to see some examples on how to write an absolute value function from a graph.
Quick Check
Given the function \( h(x) = 2|x + 3| - 6 \):
a) graph the function.
b) identify the domain and range of the function.
c) determine if the function is increasing or decreasing over the interval \( -7 \leq x \leq -4 \).
Given the function \( h(x) = 2|x + 3| - 6 \):
a) graph the function.
b) identify the domain and range of the function.
c) determine if the function is increasing or decreasing over the interval \( -7 \leq x \leq -4 \).