
|
Graphing Quadratic Functions Target B
|

|
Looking at the two quadratic functions below, Natalie thinks that the graphs will be different. MacKenzie thinks that the graphs will be the same. Who do you agree with and why?
\(f(x) = (x + 2)( x - 4)\) \(g(x) = (x - 1)^2 + 9\) |
The graph of a quadratic function, like the one above is a curve called a parabola . Let's look at some crucial components of the graph.
Components of Parabolas
Line of symmetry or axis of symmetry: the orange dotted vertical line that goes down the center of the parabola. This is the line that divides the parabola into two symmetrical sections.
Vertex: The highest (maximum) or lowest (minimum) point on the graph: it is the turning point of the graph. The line of symmetry goes through the vertex.
\(x\)-intercepts: The point(s) where the graph crosses the \(x\)-axis.
\(y\)-intercept: The point where the graph crossed the \(y\)-axis.
There are 3 forms of a quadratic equation that we will use. We will graph the quadratic function from each of these forms. Each form has key information that will help in the graphing of each. When we graph a quadratic function we will want to make sure we graph the vertex, two additional points and include the axis of symmetry. Each image below links to a page which will teach you how to graph from each of the forms.
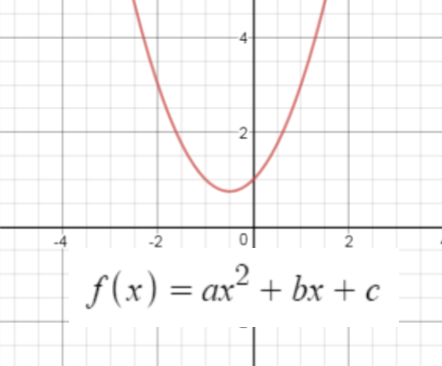
Standard Form
|
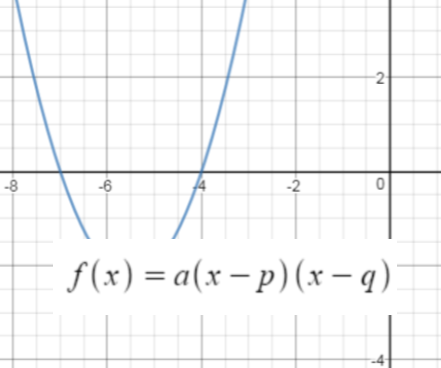
Intercept Form
|
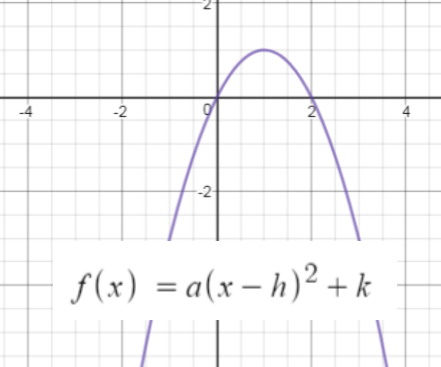
Vertex Form
|