Graphing a Linear Function with a Restricted Domain (Compound Inequality)
When a linear function has a domain that is represented by a compound inequality (for example, \( -1< x < 2 \) ), the graph of the function will look like a segment. A segment has two endpoints. There are two ways that can be used to graph a linear function with a compound inequality as the domain.
Method 1: Make a Table
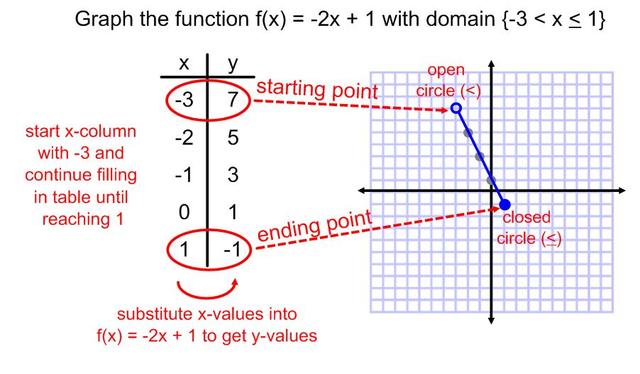
Let's say we wanted to graph the function \( f(x) = -2x + 1 \) with domain: \( \{x: -3 < x \leq 1 \} \). The first step would be to create an x/y table. The values that are chosen for the x-column are going to depend on the compound inequality given in the domain. In this example, the compound inequality is \( -3 < x \leq 1 \), so the first number that we would select for the x-column would be \( -3 \), and we would continue filling in the \(x\)-column until we reach an \(x\)-value of \( 1 \), since that is the other value in the inequality. The next step would be to substitute in the \(x\)-values into the function in order to get the corresponding \(y\)-values to fill in the table. Then you would take the ordered pairs from the table and plot them on the graph. Next comes the creation of the segment. The first ordered pair in the x/y table represents the first endpoint. The last ordered pair in the x/y table represents the other endpoint. When you are drawing the endpoints, make sure to pay attention to the inequality symbols given in the domain, in order to know what type of circle to create (open or closed). Once the endpoints have been marked on the graph, connect them to form a segment.
Method 1: Make a Table
Let's say we wanted to graph the function \( f(x) = -2x + 1 \) with domain: \( \{x: -3 < x \leq 1 \} \). The first step would be to create an x/y table. The values that are chosen for the x-column are going to depend on the compound inequality given in the domain. In this example, the compound inequality is \( -3 < x \leq 1 \), so the first number that we would select for the x-column would be \( -3 \), and we would continue filling in the \(x\)-column until we reach an \(x\)-value of \( 1 \), since that is the other value in the inequality. The next step would be to substitute in the \(x\)-values into the function in order to get the corresponding \(y\)-values to fill in the table. Then you would take the ordered pairs from the table and plot them on the graph. Next comes the creation of the segment. The first ordered pair in the x/y table represents the first endpoint. The last ordered pair in the x/y table represents the other endpoint. When you are drawing the endpoints, make sure to pay attention to the inequality symbols given in the domain, in order to know what type of circle to create (open or closed). Once the endpoints have been marked on the graph, connect them to form a segment.
Method 2: Make a Graph
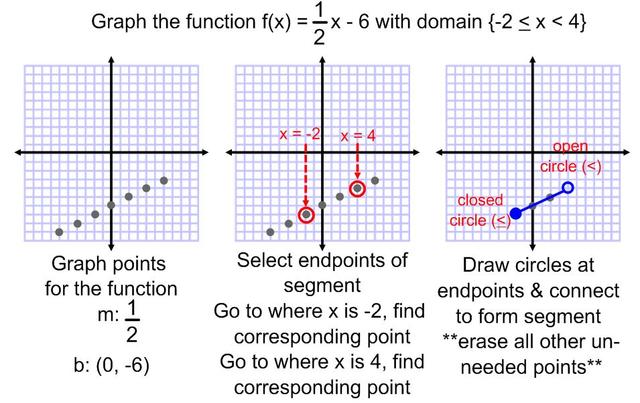
Let's talk about how to graph the function \( f(x) = \frac{1}{2}x - 6 \) with domain \( \{x: -2 \leq x < 4 \} \). Just like with a single inequality, when the function has a compound inequality for the domain, the first step would be to graph the function \( f(x) = \frac{1}{2}x + 6 \) as if there was no restricted domain. Begin by plotting the \( b \) (\(y\)-intercept), and move to additional points by using the \( m \) (slope). Draw the points lightly on the graph, as we will erase any unnecessary points later on. Do not connect the points by drawing a line. We know not to draw a line because there is a restricted domain given, and that the graph should look like a segment, with specific starting and ending points. To locate the endpoints of the segment, we need to look at the numbers given in the compound inequality. In this case, the two number creating a restriction on \( x \) are \( -2 \) and \( 4 \). So, on the graph, go to the \( -2 \) on the x-axis and move up or down along where \( x \) is \( -2 \), until you hit one of the points that were graphed previously. Draw a closed circle at this point (use a closed circle because the inequality symbol associated with the \( -2 \) is \( \leq \) ). Repeat this process, but now go to the \( 4 \) on the x-axis to find the second endpoint. Draw an open circle at this point (the inequality symbol associated with the \( 4 \) is \( < \) ). Finally, connect the two endpoints to create a segment, and erase any other points on the graph that do not fit within the given domain.
Let's talk about how to graph the function \( f(x) = \frac{1}{2}x - 6 \) with domain \( \{x: -2 \leq x < 4 \} \). Just like with a single inequality, when the function has a compound inequality for the domain, the first step would be to graph the function \( f(x) = \frac{1}{2}x + 6 \) as if there was no restricted domain. Begin by plotting the \( b \) (\(y\)-intercept), and move to additional points by using the \( m \) (slope). Draw the points lightly on the graph, as we will erase any unnecessary points later on. Do not connect the points by drawing a line. We know not to draw a line because there is a restricted domain given, and that the graph should look like a segment, with specific starting and ending points. To locate the endpoints of the segment, we need to look at the numbers given in the compound inequality. In this case, the two number creating a restriction on \( x \) are \( -2 \) and \( 4 \). So, on the graph, go to the \( -2 \) on the x-axis and move up or down along where \( x \) is \( -2 \), until you hit one of the points that were graphed previously. Draw a closed circle at this point (use a closed circle because the inequality symbol associated with the \( -2 \) is \( \leq \) ). Repeat this process, but now go to the \( 4 \) on the x-axis to find the second endpoint. Draw an open circle at this point (the inequality symbol associated with the \( 4 \) is \( < \) ). Finally, connect the two endpoints to create a segment, and erase any other points on the graph that do not fit within the given domain.