Graphing a Linear Function with a Restricted Domain (Single Inequality)
The graphs of linear functions can look very different based on the domains of the functions. As we learned in Unit 2, when a linear function has a domain that is discrete (a set of specific \(x\)-values), the graph will look like a set of specific points. When a linear function has a domain that is represented by a single inequality (for example, \( x > 2 \)), the graph of the function will look like a ray. A ray has an initial (starting) point and extends in one direction. There are two ways that can be used to graph a linear function with an inequality as the domain.
Method 1: Make a Table
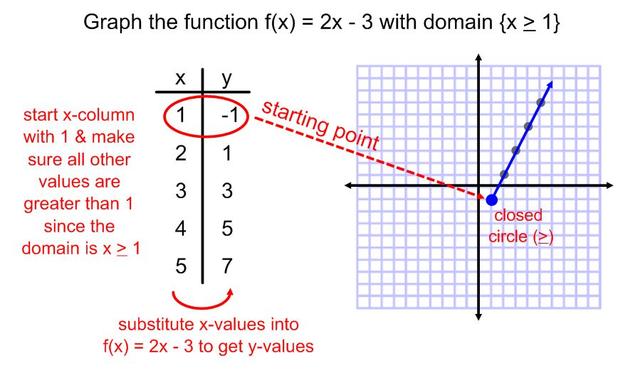
Let's say we wanted to graph the function \( f(x) = 2x -3 \) with domain: \( \{ x: x \geq 1 \} \). The first step would be to create an x/y table. The values that are chosen for the x-column are going to depend on the inequality given in the domain. In this example, the inequality is \( x \geq 1 \), so the first number that we would select for the x-column would be \( 1 \). Since the inequality reads "x is greater than or equal to 1", the other x-values that are selected to go in the table would have to be greater than \( 1 \), such as \( 2, 3, 4, 5, \) etc. (if the inequality was \( x < 3 \), then we would start the table with a \( 3 \) in the \( x \) column, and then make sure every other \(x\)-value selected was less than \( 3 \), such as \( 2, 1, 0, -1 \). The next step would be to substitute in the \(x\)-values into the function in order to get the corresponding \(y\)-values to fill in the table. Then you would take the ordered pairs from the table and plot them on the graph. How do we know where to draw the ray? The initial point of the ray comes from the very first point selected in the table (which came from the inequality in the domain!). When you create the initial point, keep in mind that there are two different types of circles when graphing inequalities: open and closed. Open circles are drawn when given these inequality symbols : \( < \) or \( > \). Closed circles are drawn when given these inequality symbols: \( \leq \) or \( \geq \). Once the starting point has been marked on the graph, just draw an arrow from that point through the other points on the graph that came from the table.
Method 1: Make a Table
Let's say we wanted to graph the function \( f(x) = 2x -3 \) with domain: \( \{ x: x \geq 1 \} \). The first step would be to create an x/y table. The values that are chosen for the x-column are going to depend on the inequality given in the domain. In this example, the inequality is \( x \geq 1 \), so the first number that we would select for the x-column would be \( 1 \). Since the inequality reads "x is greater than or equal to 1", the other x-values that are selected to go in the table would have to be greater than \( 1 \), such as \( 2, 3, 4, 5, \) etc. (if the inequality was \( x < 3 \), then we would start the table with a \( 3 \) in the \( x \) column, and then make sure every other \(x\)-value selected was less than \( 3 \), such as \( 2, 1, 0, -1 \). The next step would be to substitute in the \(x\)-values into the function in order to get the corresponding \(y\)-values to fill in the table. Then you would take the ordered pairs from the table and plot them on the graph. How do we know where to draw the ray? The initial point of the ray comes from the very first point selected in the table (which came from the inequality in the domain!). When you create the initial point, keep in mind that there are two different types of circles when graphing inequalities: open and closed. Open circles are drawn when given these inequality symbols : \( < \) or \( > \). Closed circles are drawn when given these inequality symbols: \( \leq \) or \( \geq \). Once the starting point has been marked on the graph, just draw an arrow from that point through the other points on the graph that came from the table.
Method 2: Make a Graph
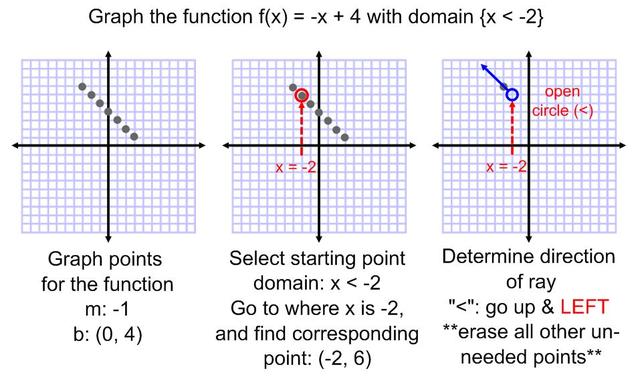
What if we wanted to graph the function without making a table? This is possible! Let's graph the function \( f(x) = -x + 4 \) with domain \( \{x: x < -2 \} \). The first step would be to graph the function \( f(x) = -x + 4 \) as if there was no restricted domain. Begin by plotting the "\( b \)" (y-intercept), and move to additional points by using the "\( m \)" (slope). Draw the additional points lightly on the graph. Do not connect the points by drawing a line. We know not to draw a line because there is a restricted domain given, and that the graph should look like a ray. To locate the initial point of the ray, we need to look at the number given in the inequality. In this case, the number is \( -2 \). So, on your graph, go to the \( -2 \) on the x-axis. Then, move up or down along where \( x \) is \( -2 \), until you hit one of the points that were graphed previously. Draw an open circle at this point (use an open circle because the inequality symbol in this example is \(<\)). To determine which direction to draw the ray, look at the symbol given in the inequality. If the symbol is a \( < \) or \( \leq \), draw the arrow either up and to the LEFT, or down and to the LEFT. If the symbol is a \( > \) or \( \geq \), draw the arrow either up and to the RIGHT, or down and to the RIGHT.
What if we wanted to graph the function without making a table? This is possible! Let's graph the function \( f(x) = -x + 4 \) with domain \( \{x: x < -2 \} \). The first step would be to graph the function \( f(x) = -x + 4 \) as if there was no restricted domain. Begin by plotting the "\( b \)" (y-intercept), and move to additional points by using the "\( m \)" (slope). Draw the additional points lightly on the graph. Do not connect the points by drawing a line. We know not to draw a line because there is a restricted domain given, and that the graph should look like a ray. To locate the initial point of the ray, we need to look at the number given in the inequality. In this case, the number is \( -2 \). So, on your graph, go to the \( -2 \) on the x-axis. Then, move up or down along where \( x \) is \( -2 \), until you hit one of the points that were graphed previously. Draw an open circle at this point (use an open circle because the inequality symbol in this example is \(<\)). To determine which direction to draw the ray, look at the symbol given in the inequality. If the symbol is a \( < \) or \( \leq \), draw the arrow either up and to the LEFT, or down and to the LEFT. If the symbol is a \( > \) or \( \geq \), draw the arrow either up and to the RIGHT, or down and to the RIGHT.