
|
Exponential Functions Target B
|

|
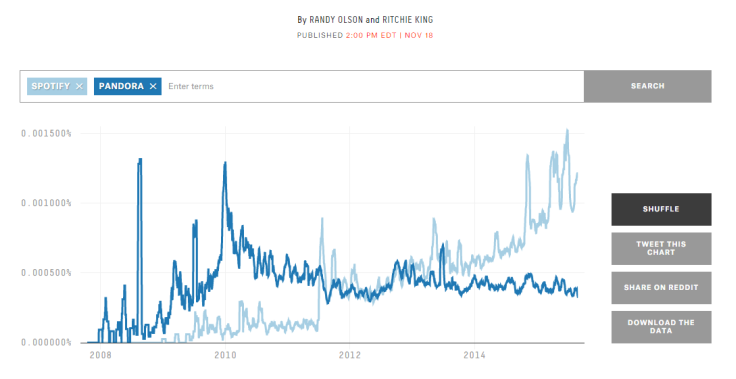
The graph on the right represents the change in popularity of the use of the words Spotify and Pandora on the
website Reddit from 2007 through 2015. Predict what the frequency of these two terms will be in 2016. Explain your reasoning. From http://fivethirtyeight.com/ and work by Rachel Fruin |
When comparing exponential functions, there are two key components to consider. Look at the function \( f(x) = a \cdot b^x \). The “\( a \)” value represents where the function intersects the y-axis, so this can be considered the y-intercept. The “\( b \)” value, or the base of the function, represents the growth factor which determines if the function is a growth or decay function, and the rate at which the function is growing or decaying. Take a look at the applet below.
|
What happens to the function as the “\( a \)” value becomes greater than \( 1 \)? Negative? What happens to the function as the “\( b \)” value becomes greater than \( 2 \)? What if the “\( b \)” value is between \( 0 \) and \( 1 \)? |
|
When comparing exponential functions, we can use the following descriptors:
For the “\( a \)” value:
For the “\( b \)” value:
End Behavior
End Behavior describes what direction the "ends" of an exponential function are heading on a graph. We say the end behavior of a function approaches \( 0 \) if the graph of the function gets closer and closer to the x-axis. We say the end behavior of a function approaches positive infinity if the graph of the function continues to go up, and approaches negative infinity if the end of the graph of function continues to go down. When describing end behavior, you may see something that looks like this:
For the “\( a \)” value:
- \( a \) is negative: graph is reflected in the x-axis
- \( 0 < a < 1 \): graph is vertically compressed
- \( a > 1 \): graph is vertically stretched
For the “\( b \)” value:
- \( 0 < b < 1 \): the function is a decay function
- \( b > 1 \): the function is a growth function; as b gets larger, the graph grows more quickly
End Behavior
End Behavior describes what direction the "ends" of an exponential function are heading on a graph. We say the end behavior of a function approaches \( 0 \) if the graph of the function gets closer and closer to the x-axis. We say the end behavior of a function approaches positive infinity if the graph of the function continues to go up, and approaches negative infinity if the end of the graph of function continues to go down. When describing end behavior, you may see something that looks like this:
\( x\rightarrow \infty ; y\rightarrow \infty\\ x\rightarrow-\infty; y\rightarrow0\ \)
The way you would describe this end behavior is by saying "as \( x \) approaches positive infinity, \( y \) approaches positive infinity, and as \( x \) approaches negative infinity, \( y \) approaches \( 0 \)". Let's take a look at the sketches below and describe their end behavior.
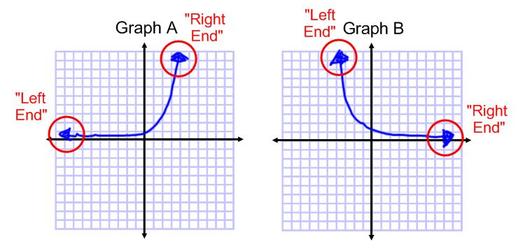
Looking at Graph A, you can see the left end of the graph will continue to get closer and closer to the x-axis (the line \( y = 0 \) ) as it moves to the left (remember the graph will never actually touch the x-axis...see Expo A). The right end of the graph will continue to increase as it moves to the right. Because the left end gets closer to the x-axis, and the right end will keep increasing, we would describe the end behavior like so: As \( x \) approaches to negative infinity, \( y \) approaches zero, and as \( x \) approaches positive infinity, \( y \) approaches positive infinity. It would look something like this:
\( x\rightarrow- \infty ; y\rightarrow0\\ x\rightarrow\infty; y\rightarrow\infty\ \)
Looking at Graph B, you can see the left end of the graph will continue to increase as \( x \) continues to decrease, and the right end of the graph will get closer and closer to the x-axis as it moves to the right. We would describe the end behavior of graph B like so: As \( x \) approaches negative infinity, y approaches positive infinity. As \( x \) approaches positive infinity, \( y \) approaches \( 0 \). This is how the end behavior is written:
\( x\rightarrow- \infty ; y\rightarrow\infty \\ x\rightarrow\infty; y\rightarrow0\ \)
Example 1: Describe the graphs of the following functions.
a) \( g(x) = -3 \cdot 2^x \)
The “\( a \)” value is \( -3 \) which means the graph of the function intersects the y-axis at \( (0, -3) \). The “\( b \)” value is a \( 2 \) so this is a growth function. So to describe the function \( g(x) \) we would say that \( g(x) \) is a growth function that is reflected in the x-axis and has a y-intercept at \( (0, -3) \).
b) \( h(x) = \left( \frac{1}{2} \right) ^ x \)
The “\( b \)” value is \( \frac{1}{2} \). Since the “\( b \)” value is between \( 0 \) and \( 1 \), we would describe this function as a decay function.
c) \( j(x) = 2(4)^x \)
For \( j(x) \), the “\( a \)” value is \( 2 \) and the “\( b \)” value is \( 4 \). This means that the graph of the function intersects the y-axis at \( (0, 2) \). Since the “\( a \)” value is greater than \( 1 \), using the descriptors above we would say that the graph of the function is vertically stretched. Since the “\( b \)” value is greater than \( 2 \), we would say that the function is a growth function and grows more quickly.
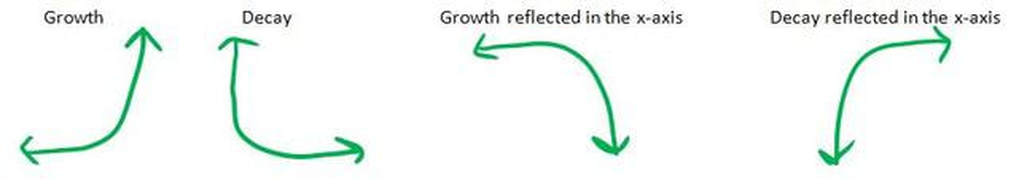
Sketching Exponential Functions
As a general reference, when sketching exponential functions, the function will look one of four ways depending on if the function represents exponential growth or decay. Here are the possibilities:
a) \( g(x) = -3 \cdot 2^x \)
The “\( a \)” value is \( -3 \) which means the graph of the function intersects the y-axis at \( (0, -3) \). The “\( b \)” value is a \( 2 \) so this is a growth function. So to describe the function \( g(x) \) we would say that \( g(x) \) is a growth function that is reflected in the x-axis and has a y-intercept at \( (0, -3) \).
b) \( h(x) = \left( \frac{1}{2} \right) ^ x \)
The “\( b \)” value is \( \frac{1}{2} \). Since the “\( b \)” value is between \( 0 \) and \( 1 \), we would describe this function as a decay function.
c) \( j(x) = 2(4)^x \)
For \( j(x) \), the “\( a \)” value is \( 2 \) and the “\( b \)” value is \( 4 \). This means that the graph of the function intersects the y-axis at \( (0, 2) \). Since the “\( a \)” value is greater than \( 1 \), using the descriptors above we would say that the graph of the function is vertically stretched. Since the “\( b \)” value is greater than \( 2 \), we would say that the function is a growth function and grows more quickly.
Sketching Exponential Functions
As a general reference, when sketching exponential functions, the function will look one of four ways depending on if the function represents exponential growth or decay. Here are the possibilities:
Watch the videos below to see examples on how to sketch an exponential function.
Quick Check
1) Compare \( k(x) = 5 \cdot 3^x \) to \( h(x) = 3^x \).
2) Which function would grow more quickly? \( h(x) = 4 \cdot 6^x \) or \( k(x) = 6 \cdot 4^x \)
3) Create a function that would represent exponential decay and whose graph would be stretched.
1) Compare \( k(x) = 5 \cdot 3^x \) to \( h(x) = 3^x \).
2) Which function would grow more quickly? \( h(x) = 4 \cdot 6^x \) or \( k(x) = 6 \cdot 4^x \)
3) Create a function that would represent exponential decay and whose graph would be stretched.