|
|
Statistics Target B
|
1) Check out this video:
This obviously piqued your interest (trust me, it did) in biking to school and you took a survey in your class of \(30\) students and the results are as follows:
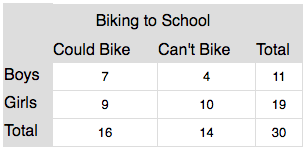
a) How many boys are in the set?
b) How many girls are in the set?
c) How many students can bike?
d) How many girls can't bike?
e) Create a two way frequency table (with respect to the table total).
f) With respect to the total what percent of girls could bike?
g) Create a two way frequency table (with respect to the rows).
h) What percent of boys could bike?
i) Create a two way frequency table (with respect to the columns).
j) What percent of of people that could bike are girls?
2) There are \(150\) children at a local pool are signed up in the aquatic sports of which \(61\) signed up for swim team. There were a total of \(52\) children that signed for water polo and \(28\) of them also signed up for swim team. Use the two-way frequency table below to summarizing the data.
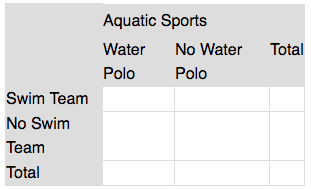
a) How many children did not sign up for water polo? Does this represent a marginal or joint frequency?
b) How many students did not sign up for either water polo or swim team? Does this represent a marginal or joint
frequency?
3) You are in charge of boosting profits for the concession stand at the basketball games. You decide to do some research. On Friday night as each person entered the basketball game, you counted how many of the \(400\) people had a hot dog, a slice of pizza, soda and bottled water. You found that out of \(182\) people that had Pizza, \(120\) chose soda and only four did not have a drink. \(50\) people bought a hot dog and a soda. \(158\) people bought hot dogs. Ten people walked in without any food or a drink. The stand sold \(200\) sodas and \(140\) waters. Using this data, fill in the two way frequency table and determine the marginal frequencies of the data.
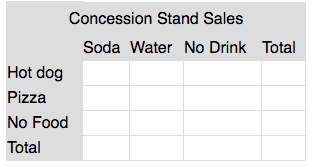
a) What was the joint frequency of people who ordered pizza AND a drink?
b) Based on the data, is it more likely that people will order pizza without a drink or a hot dog without a drink? Justify
your answer using information from the frequency table.
b) Based on the data, is it more likely that people will order pizza without a drink or a hot dog without a drink? Justify
your answer using information from the frequency table.