|
|
Linear Systems Target D
|
1) Drag the points and use the check boxes to build the system. Sketch the solution. Give one point that would satisfy the system.
2) Drag the points and use the check boxes to build the system. Sketch the solution. Give one point that would satisfy the system.
Graph each system by hand.
3) \( \begin{align*} &y<3x \\ & y \geq -2x+1 \\ \end{align*} \)
4) \( \begin{align*} &y<x−4 \\ & x+y \geq 3 \\ \end{align*} \)
5) \( \begin{align*} &y \geq 0 \\ & x>-3 \\ & 2x+3y \leq 6 \\ \end{align*} \)
3) \( \begin{align*} &y<3x \\ & y \geq -2x+1 \\ \end{align*} \)
4) \( \begin{align*} &y<x−4 \\ & x+y \geq 3 \\ \end{align*} \)
5) \( \begin{align*} &y \geq 0 \\ & x>-3 \\ & 2x+3y \leq 6 \\ \end{align*} \)
6) Press the play button and witness the construction of a system of linear inequalities. Write down the system.
7) Drew owns a floating ice cream stand on a lake just off a public beach. He is trying to get ready for the big holiday weekend. Drew stocks both bomb-pops and ice cream sandwiches. He figures he has enough space for \( 50 \) boxes (they are the same size) and he thinks that he can sell them all. The bomb-pops come in a dozen per box and cost him \( \$ 1.98 \) for a box. The ice cream sandwiches come in \( 6 \) per box and cost him \( \$ 5.40 \) for a box. He only has \( \$ 150 \) to spend on materials. Given the following axis graph the inequality. What are some possible combinations that Drew could consider? Is one answer better than the others?
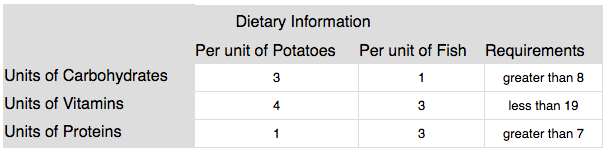
8) Suppose you went camping for two weeks and the only things available were fish you caught and the potatoes you hiked in with. You are also training for your school dance team and the decision about how much of each food to eat is to made entirely on dietary information. We have the nutritional information in the following table. Graph the solution. What are some possible combinations of each food that you could eat?
Review
9) Graph \(y < 3x - 8\)
10) Graph \(y \geq -\dfrac{1}{7}x + 8\)
11) Graph \(3x - 2y > 2\)
12) Below is a table of automobile weight and fuel economy in miles per gallon. What is the linear regression equation for the data?
9) Graph \(y < 3x - 8\)
10) Graph \(y \geq -\dfrac{1}{7}x + 8\)
11) Graph \(3x - 2y > 2\)
12) Below is a table of automobile weight and fuel economy in miles per gallon. What is the linear regression equation for the data?
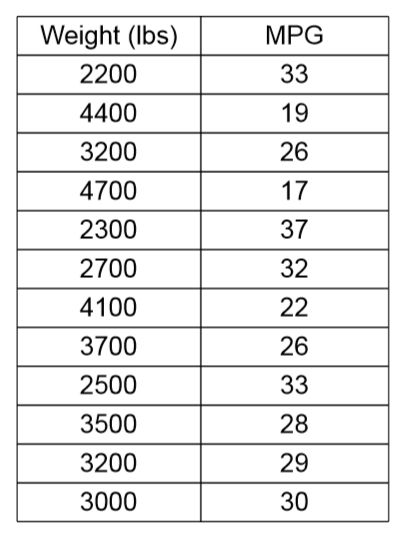
13) Using your regression function, what is fuel economy for an automobile that weighs \(2500\) lbs?
14) Using your regression function, what is the weight of an automobile that gets \(24\) miles per gallon?
14) Using your regression function, what is the weight of an automobile that gets \(24\) miles per gallon?