
|
Library of Functions Target C
|

|
Noor thinks that measuring the amount of M&Ms in a bowl is the same as measuring the amount of chocolate syrup in the same type of bowl. Tariq disagrees with Noor. Whom do you agree with and why?
|
A graph of a linear function can be considered continuous or discrete depending the DOMAIN of the function.
Continuous
If the domain of a function is all real numbers, then the graph of the function is continuous.
Example 1: Graph \( f(x) = 3x - 1 \); Domain: the set of all real numbers.
Note, the symbol \( \mathbb{R} \) is often used to denote the set of all real numbers.
Solution: In order to graph the function, create a table of values, choose \(x\)-values and substitute into the function in order to find the corresponding \(y\)-values. The numbers chosen below are \( \{-2, -1, 0, 1 \} \), but any \(x\)-values can be used because the domain is all real numbers. The numbers selected for the domain will vary depending on the function (i.e. if the function is \(y = \frac{1}{2}x + 4 \), then the x-values chosen should be multiples of \(2\), such as \(-4,\ -2,\ 0,\ 2,\ 4,\) in order to make multiplying by \( \large\frac{1}{2} \) easier).
\begin{array}{|c|c|c|}\hline x & f(x)=3x-1 & f(x) \\ \hline -2 & f(-2)=3(-2)-1& -7 \\ \hline -1& f(-1)=3(-1)-1 & -4 \\ \hline 0& f(0)=3(0)-1& -1 \\ \hline 1 & f(1)=3(1)-1& 2 \\ \hline \end{array}
Then, plot the coordinates on a graph, and connect to form a continuous line.
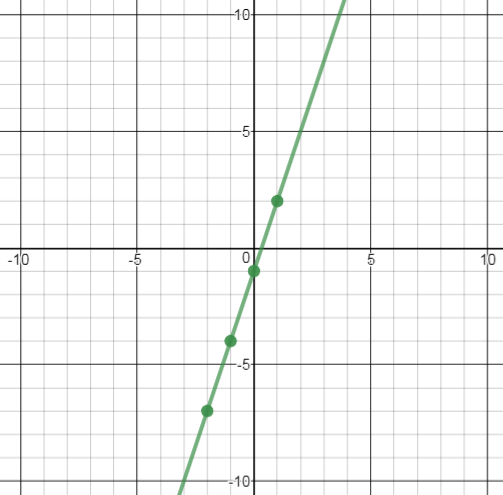
In this case, since the domain of the function is all real numbers, then the range of the function is also all real numbers. This will be the case for the majority of linear functions. If the domain is the set of all real numbers, then the range is also the set of all real numbers.
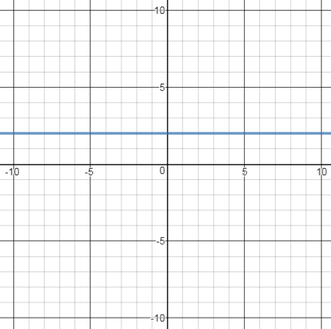
There are special cases where this does not happen, however, so you always need to make sure to check the graph of the function when determining the range. For example, if we had the function \( f(x) = 2 \), then the graph of the line would be a horizontal line passing through \( (0, 2) \) on the y-axis. No matter which \(x \) value you evaluate \(f \) at, you get back \(2 \). So the range would be \( \{ 2 \} \), and not all real numbers. This is the set containing only one element, the number \(2 \).
There are special cases where this does not happen, however, so you always need to make sure to check the graph of the function when determining the range. For example, if we had the function \( f(x) = 2 \), then the graph of the line would be a horizontal line passing through \( (0, 2) \) on the y-axis. No matter which \(x \) value you evaluate \(f \) at, you get back \(2 \). So the range would be \( \{ 2 \} \), and not all real numbers. This is the set containing only one element, the number \(2 \).
|
Domain: \( \mathbb{R} \)
Range: \( \{ 2 \} \) |
|
Discrete
If the domain of a function is a given set of x-values, then the graph of the function is discrete. Let's take a look using the same function as above.
Example 2: Graph \( f(x) = 3x - 1 \); Domain: \( \{-2, -1, 0, 1\} \)
Solution: In order to graph this function, use only the given domain to find the range.
\begin{array}{|c|c|c|}\hline x & f(x)=3x-1 & f(x) \\ \hline -2 & f(-2)=3(-2)-1& -7 \\ \hline -1& f(-1)=3(-1)-1 & -4 \\ \hline 0& f(0)=3(0)-1& -1 \\ \hline 1 & f(1)=3(1)-1& 2 \\ \hline \end{array}
Then, plot the coordinates on a graph, but this time, do not draw a line through the points. The graph of the function is discrete because the graph should only represent the values of the specific domain.
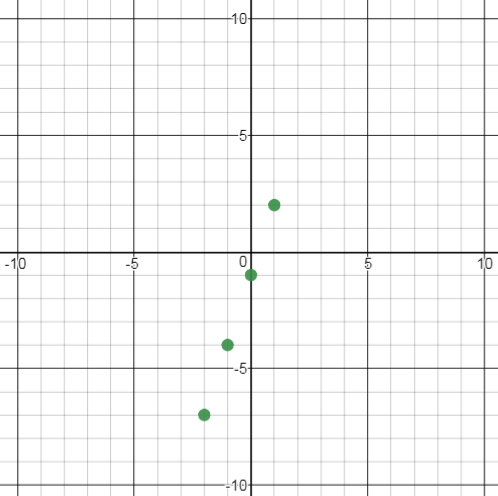
The range of the function would only consist of \( \{-7, -4, -1, 2\} \).
Quick Check
1) Graph the function \(y = 2x - 1 \) with Domain: \( \mathbb{R} \). Identify the range.
2) Graph the function \(y = 2x - 1 \) with Domain: \( \{-3, -1, 0, 1, 3 \} \). Identify the range.
Quick Check Solutions
1) Graph the function \(y = 2x - 1 \) with Domain: \( \mathbb{R} \). Identify the range.
2) Graph the function \(y = 2x - 1 \) with Domain: \( \{-3, -1, 0, 1, 3 \} \). Identify the range.
Quick Check Solutions