|
|
Writing Linear Functions Target D
|
1) Use the app below to answer the following questions.
1a) Check the box List 1, describe the correlation then check the box for Best Fit 1 to confirm your description.
b) Check the box List 2, describe the correlation then check the box for Best Fit 2 to confirm your description.
c) Check the box List 3, describe the correlation then check the box for Best Fit 3 to confirm your description.
d) Check the box List 4, describe the correlation then check the box for Best Fit 4 to confirm your description.
e) Check the box List 5, describe the correlation then check the box for Best Fit 5 to confirm your description.
2) You decided to collect data on how much time you studied for your Mathematics tests and what grade you earned. Below is the data that you collected. Click on the "Show Data" check box int that app to graph the data.
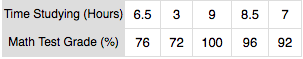
2a) What is the trend of the data?
b) Next click on the "Show Regression" check box to show the line of best fit.
c) Does this line match with your prediction?
d) If you did not study at all what would you predict your score would be?
e) If you had only \(6\) hours to study, what would your predict your score would be?
b) Next click on the "Show Regression" check box to show the line of best fit.
c) Does this line match with your prediction?
d) If you did not study at all what would you predict your score would be?
e) If you had only \(6\) hours to study, what would your predict your score would be?
3) You and your college buddies started a clothing business that sells custom t-shirts online. Below is data that you collected about the money you are spending on advertising and the sales for specific months.
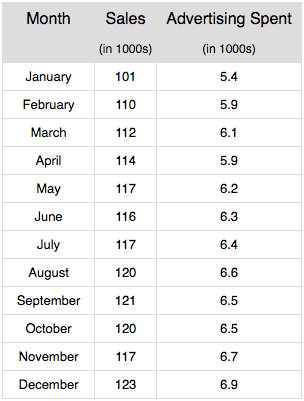
3a) On a graphing utility graph the Sales with respect to the Advertising Spent.
b) Determine the best fit line for the for the data that models the Sales as a function of Advertising Spent.
c) If the trend to continues and you were to spend \(\$10,000\) on Advertising, what would you predict the Sales would be?
d) If you wanted sales to be \(\$120,000\), what would you invest in Advertising?
4) Below is a graph of the prices of Apple (AAPL) stock for five years.
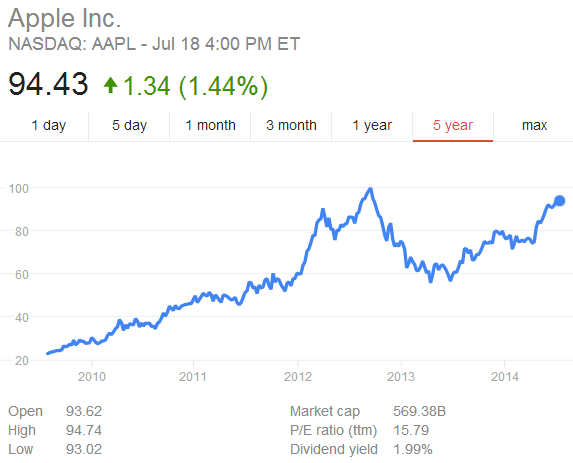
From the above graph you pulled the values of the stock at the first day (January 1st) of each year.
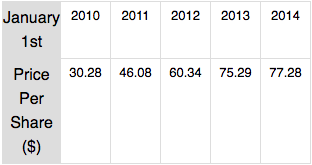
a) Determine the best fit line for the data that models the Apple Stock Price as a function of Years since \(2010\).
b) Based on your linear regression model, what would you predict the Price would be in \(2016\)?
5) According to the U.S. Bureau of Labor Statistics Data, the below table represents the unemployment at the end of each calendar year.
b) Based on your linear regression model, what would you predict the Price would be in \(2016\)?
5) According to the U.S. Bureau of Labor Statistics Data, the below table represents the unemployment at the end of each calendar year.
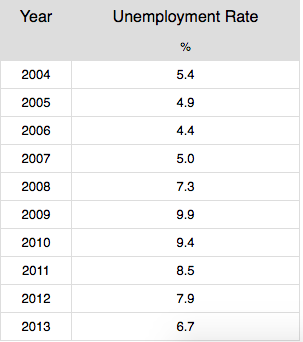
a) Determine the best fit line for the data that models the Unemployment as a function of Years since \(2004\).
b) Based on your linear regression model, what would you predict the percent Unemployment to be in \(2017\) if the trend continues?
b) Based on your linear regression model, what would you predict the percent Unemployment to be in \(2017\) if the trend continues?
Review
6) Graph the linear function \( y - 4 = -2(x + 3) \).
7) Write the following equation in function form: \( 2x - 3y = 7 \).
8) Solve the equation for \( x \): \( 7x - 4 = 3x - 10 \).
Solution Bank
6) Graph the linear function \( y - 4 = -2(x + 3) \).
7) Write the following equation in function form: \( 2x - 3y = 7 \).
8) Solve the equation for \( x \): \( 7x - 4 = 3x - 10 \).
Solution Bank