|
Writing Linear Functions Target E
|

|
Megan & Kelly are shopping at a clothing store. There are two discount options available. Megan thinks that the better deal is a \(\$10\) rebate for every \(\$50\) spent that can be used for future purchases at the store. Kelly thinks the better deal is \( 20 \% \) off the purchase price of any item.
Whom do you agree with and why? |
An arithmetic sequence can be represented by a set of numbers that either increase or decrease by a constant value. Examples of an arithmetic sequence are given by the following:
Set C:
\(2,\ 8,\ 14,\ 20,\ 26,\ 32,…\)
Set D:
\(34,\ 26,\ 18,\ 10,\ 2,\ -6, …\)
Set C represents an arithmetic sequence because each number in the set is being increased by \(6\) to get to the next number. Set D represents an arithmetic sequence because each number in the set is being decreased by \(8\) to get to the following number.
We can use this information to help determine whether or not a set of data represents a linear relationship.
Using the tables below, look at how the \(x\)-values and \(y\)-values change. If the values in the table increase or decrease by a constant value, then the relationship is linear. This means that if you were to graph the set of points represented in the table, they could connect to form a straight line, because they are increasing or decreasing by a constant rate of change.
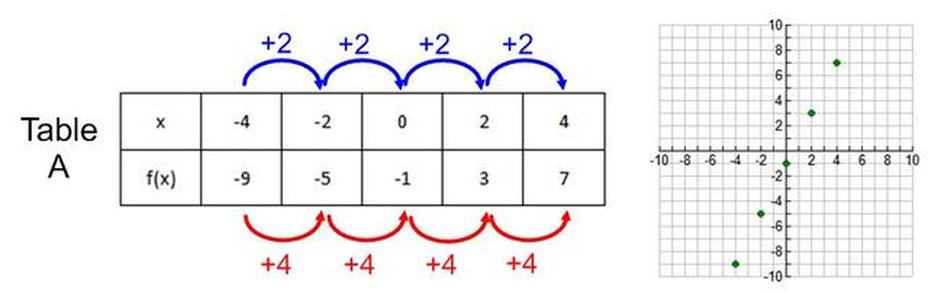
The set of data points from Table A represents a linear relationship because both the \(x\)-values and \(y\)-values are increasing by a constant value. If you look at the graph to the right, the points follow the pattern of a line.
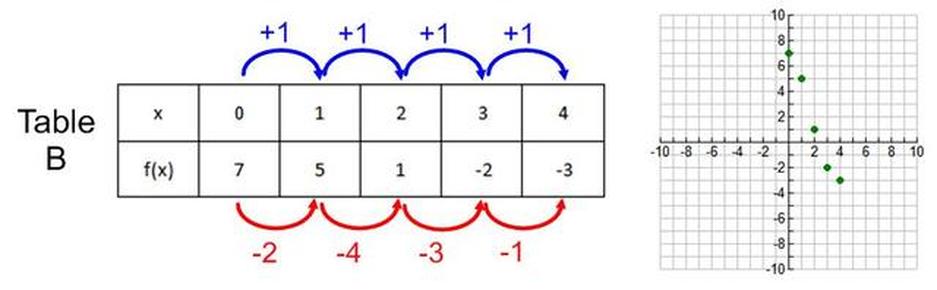
The set of data points from Table B do not represent a linear relationship because, although the \(x\)-values are increasing by a constant value, the \(y\)-values are not. Also, if you look at the graph of the points, they do not follow the pattern of a line.
Quick Check
Do the following sets of numbers represent an arithmetic sequence?
1) \(-3,\ -4,\ 13,\ 23,\ -24\)
2) \(\frac{5}{6},\frac{1}{3},\frac{-1}{6},\frac{-2}{3},\frac{-7}{6}\)
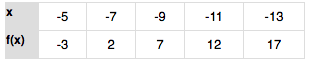
3) Does the table represent a linear relationship?
Do the following sets of numbers represent an arithmetic sequence?
1) \(-3,\ -4,\ 13,\ 23,\ -24\)
2) \(\frac{5}{6},\frac{1}{3},\frac{-1}{6},\frac{-2}{3},\frac{-7}{6}\)
3) Does the table represent a linear relationship?