
|
Library of Functions Target D
|

|
Carl thinks that the number \( 2 \) is an element of the interval \( 2 < x \leq 5 \). Bernhard disagrees and says it isn't.
Whom do you agree with and why? |
A function is described as a piecewise-defined function because it consists of different pieces. An example of a piecewise function looks like this:
\( f(x) =\begin{cases} \text{-}2x-1, \ \ &\mbox{if} \ \ x<-3 \\ 4\text, \ \ &\mbox{if} \ \ \text{-}3\leq x<1 \\ x+4 \ \ &\mbox{if} \ \ x\geq 1 \end{cases}\ \)
As you can see, the function consists of 3 pieces: \( f(x) = -2x - 1, f(x) = 4, \) and \( f(x) = x + 4 \). Each of the three pieces has a specific domain for that part of the function. Here are the domains for each of the three pieces:
So what does it mean for the function's pieces to have restricted domains? It means that the graph of the function is NOT going to consist of three lines for each of the three pieces of the function. When there are restricted domains within a piecewise-defined function, the graph consists of the following: segments, rays, and points. The following gives some guidelines on how to know what each piece of the graph would look like.
To learn how to graph linear functions with restricted domains click on the links below.
Graphing a Linear Function with a Restricted Domain (Single Inequality)
Graphing a Linear Function with a Restricted Domain (Compound Inequality)
Going back to the example above, when we graph the piecewise defined function, the graph will consist of a ray ( \( x < -3 \)), a segment ( \( -3 \leq x < 1 \) ), and then another ray ( \( x \geq 1 \)), based off of the different domains of each piece of the function. This is what each of the three pieces would look like individually:
- \( f(x) = -2x -1 \): This piece of the function has the restricted domain of \( x < -3 \).
- \( f(x) = 4 \): This piece of the function has the restricted domain of \( -3 \leq x < 1 \).
- \( f(x) = x + 4 \): This piece of the function has the restricted domain of \( x \geq 1 \).
So what does it mean for the function's pieces to have restricted domains? It means that the graph of the function is NOT going to consist of three lines for each of the three pieces of the function. When there are restricted domains within a piecewise-defined function, the graph consists of the following: segments, rays, and points. The following gives some guidelines on how to know what each piece of the graph would look like.
- If the domain is a single inequality and looks something like this: \( x \geq 1 \), then this portion of the graph will be a ray (with the ray's starting point located at the numeric value in the inequality. In this example, the ray would begin where \(x\) equals \( 1 \) ).
- If the domain is a compound inequality and looks something like this: \( -2 \leq x < 3 \), then this portion of the graph will be a segment (with endpoints located at the two numeric values in the compound inequality. In this example the endpoints of the segment would be located at \( -2 \) and \( 3 \) ).
- If the domain is an equation and looks something like this: \( x = 5 \), then this portion of the graph would be a point (with the point having an \(x\)-coordinate of the numeric value in the equation. In this example, the \(x\)-coordinate of the point would be \( 5 \)).
To learn how to graph linear functions with restricted domains click on the links below.
Graphing a Linear Function with a Restricted Domain (Single Inequality)
Graphing a Linear Function with a Restricted Domain (Compound Inequality)
Going back to the example above, when we graph the piecewise defined function, the graph will consist of a ray ( \( x < -3 \)), a segment ( \( -3 \leq x < 1 \) ), and then another ray ( \( x \geq 1 \)), based off of the different domains of each piece of the function. This is what each of the three pieces would look like individually:
|
1st Piece: \(f(x)=-2x-1,\ x<-3\)
-Ray with starting point where \(x\) has a value of \(-3\)
-Ray goes up and to the LEFT since \(<\) means "less than" -Open circle at \(-3\) (\(<\)) |
2nd Piece: \(f(x)=4,\ -3\leq x<1\)
-Segment with endpoints located where \(x\) is \(-3\) and \(x\) is \(1\)
-Closed circle at the \(-3\) (\(\leq\)) -Open circle at \(1\) (\(<\)) |
3rd Piece: \(f(x)=x+4,\ x\geq1\)
-Ray with starting point where \(x\) has a value of \(1\)
-Ray goes to the RIGHT since \(\geq\) means "greater than or equal to" -Closed circle at the \(1\) (\(\geq\)) |
To graph the piecewise function as a whole, take each of the three individual pieces and graph them together on the same coordinate plane.
Let's try one more example. Graph the following piecewise-defined function:
\( f(x)=\begin{cases}
x+3 \ \ &\mbox{if} \ \ x < 1 \\
2 \ \ &\mbox{if} \ \ x=1 \\
2x-5 \ \ &\mbox{if} \ \ x > 1
\end{cases}\ \)
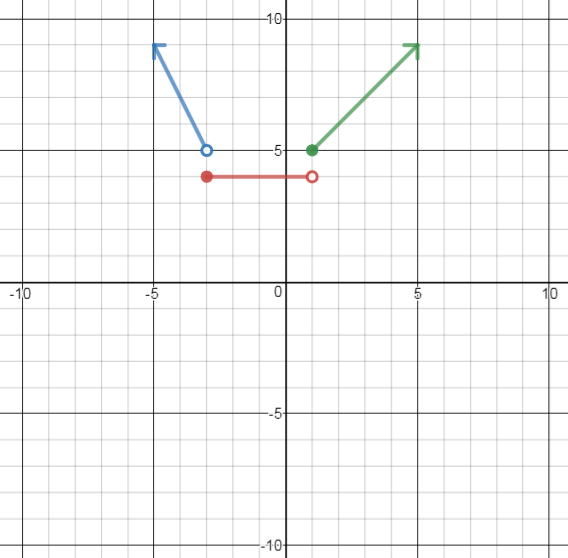
Look at the different domains for each piece of this function. Since the domains consist of an inequality ( \( x < 1 \) ), an equation ( \( x = 1 \) ), and then another inequality ( \( x > 1 \) ), the graph will consist of a ray, a point, and another ray. This is what each of the three pieces would look like individually:
|
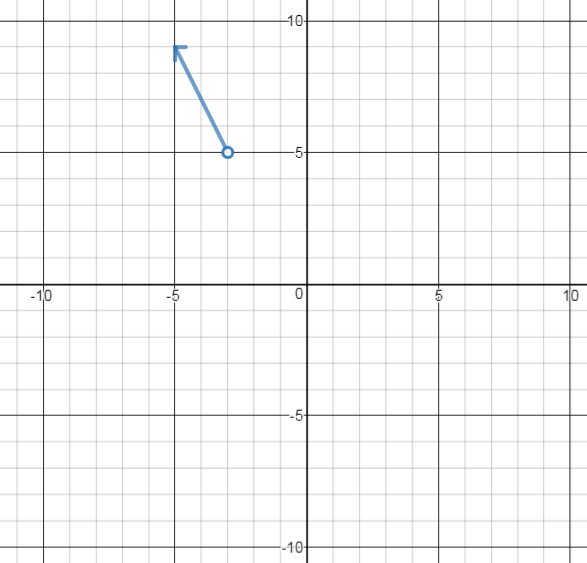
1st Piece: \(f(x)=x+3,\ x<1\)
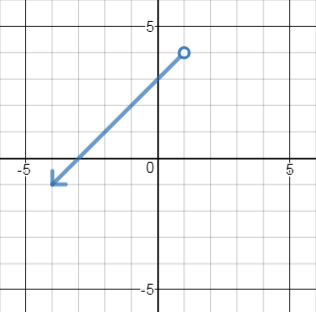
-Ray with starting point where \(x\) has a value of \(1\)
-Ray goes down and to the LEFT since \(<\) means "less than" -Open circle (\(<\)) |
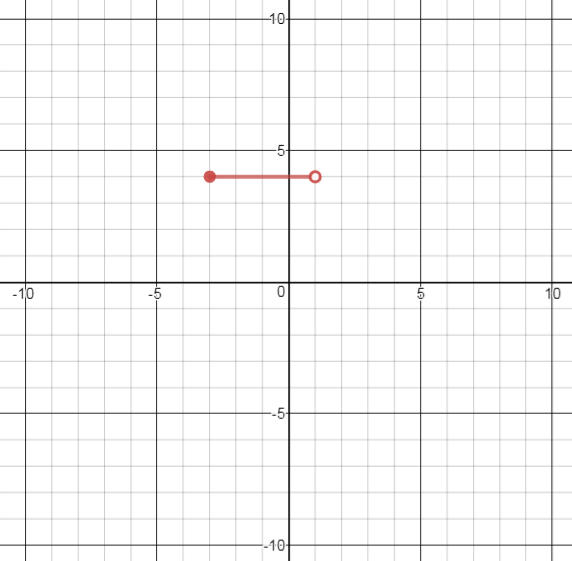
2nd Piece: \(f(x)=2,\ x=1\)
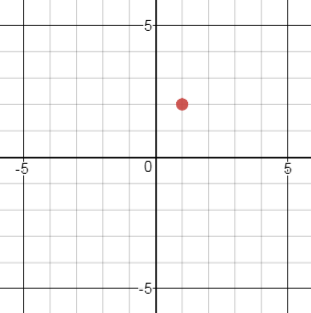
-Since point located where \(x\) is \(1\) and \(f(x)=2\)
|
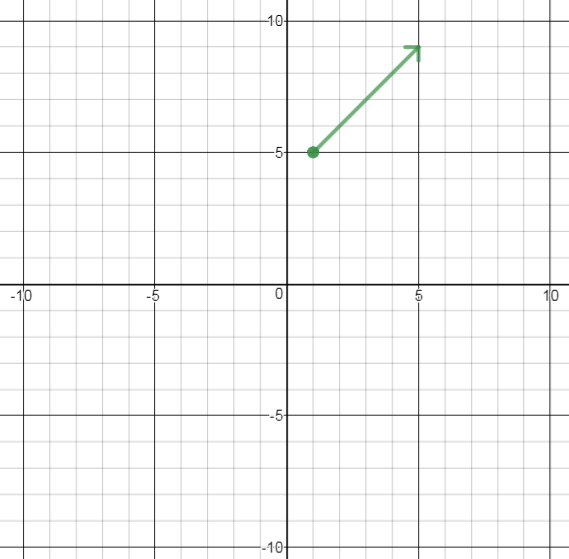
3rd Piece: \(f(x)=2x-5,\ x>1\)
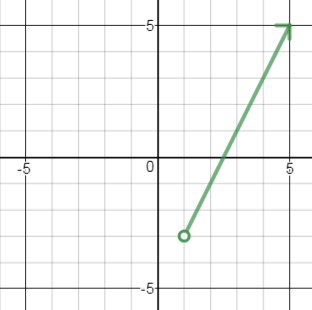
-Ray with starting point where \(x\) has a value of \(1\)
-Ray goes up and to the RIGHT since \(>\) means "greater than" -Open circle (\(>\)) |
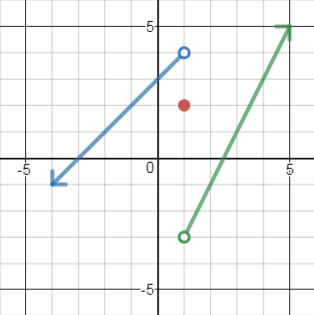
Graphing all three pieces together, will give you the graph of the overall piecewise-defined function:
Quick Check
Determine what each piece of the following function would like & then graph the function.
\( f(x)= \begin{cases} \text{-} \dfrac{1}{3}x+2 \ \ &\mbox{if} \ \ x < 0 \\ 3 \ \ &\mbox{if} \ \ 0\leq x<3 \\ \text{-}2x+7 \ \ &\mbox{if} \ \ x\geq 3 \end{cases}\ \)
Determine what each piece of the following function would like & then graph the function.
\( f(x)= \begin{cases} \text{-} \dfrac{1}{3}x+2 \ \ &\mbox{if} \ \ x < 0 \\ 3 \ \ &\mbox{if} \ \ 0\leq x<3 \\ \text{-}2x+7 \ \ &\mbox{if} \ \ x\geq 3 \end{cases}\ \)